
EKS + Prometheus + Grafana
- Install Prometheus and Grafana on Kubernetes
- Set up a website to perform a CPU stress test
- See the evolution of Prometheus metrics and Kubernetes autoscaling

Install, setup and explore the project
Get the code from this github repository :
# download the code
$ git clone \
    --depth 1 \
    https://github.com/jeromedecoster/aws-eks-prometheus-grafana.git \
    /tmp/aws

# cd
$ cd /tmp/aws
To setup the project, run the following command :
# install eksctl + kubectl, download kube-prometheus
$ make setup
This command will :
- Install eksctl if it is not already installed.
- Install kubectl if it is not already installed.
- Download a kube-prometheus release.
Let’s test the website :
# run the website locally
$ make dev
By opening the address http://localhost:3000 you can see the website :
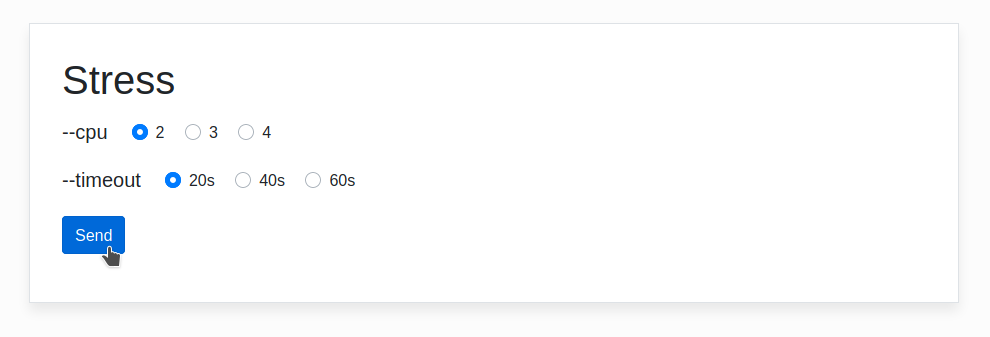
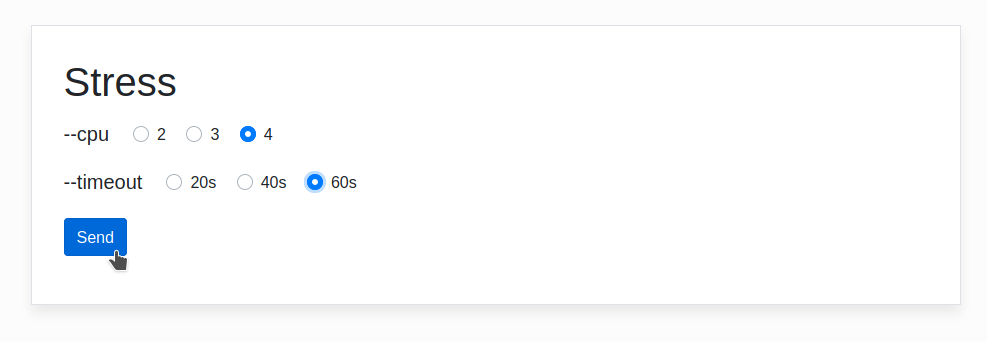
It’s a website built with a node that allows you to play with the stress executable :
const { execFile } = require('child_process')
const bodyParser = require('body-parser')
const nunjucks = require('nunjucks')
const express = require('express')

const app = express()

// ...

app.post('/stress', (req, res) => {
    console.log(req.body)
    const cpu = req.body.cpu
    const timeout = req.body.timeout
    execFile('/usr/bin/stress', ['--cpu', cpu, '--timeout', timeout])
    return res.render('stress', {cpu, timeout})
})
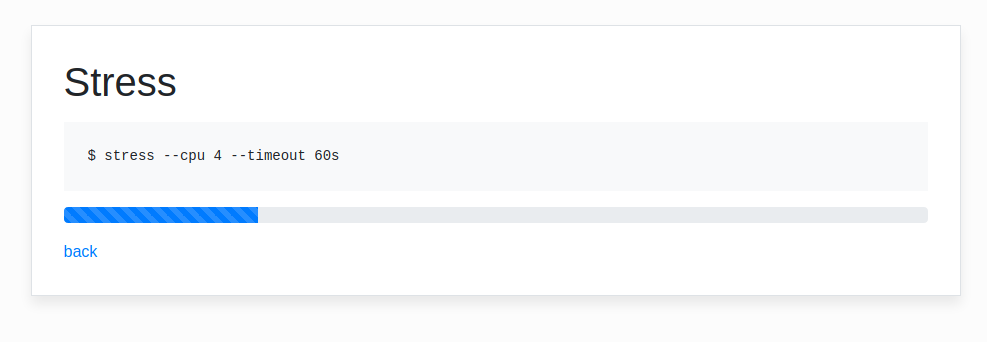
We execute the stress by clicking on the send button :
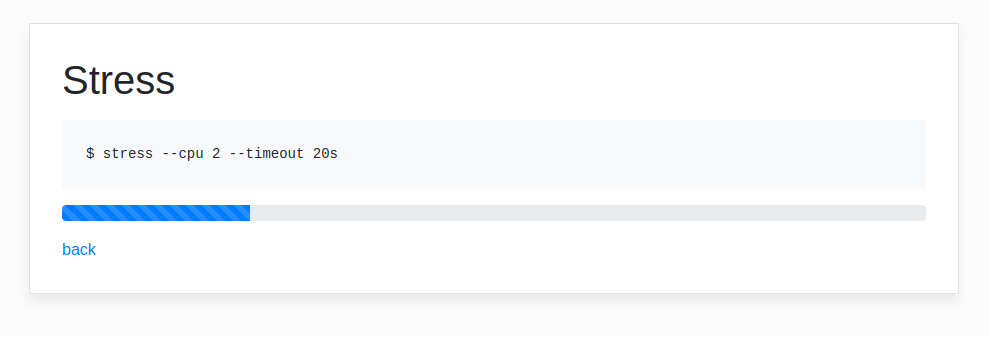
I am using htop to see that 2 processor cores are at full capacity for 20 seconds :
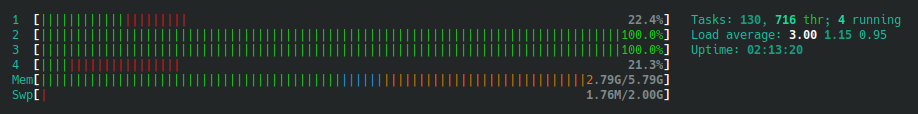
We can stop the website with Ctrl + C.
This site has been transformed into a docker image via this Dockerfile :
FROM softonic/node-prune AS prune

FROM polinux/stress AS stress

FROM node:14.11-alpine AS build
# With `NODE_ENV=production` npm install will skip devDependencies packages
ENV NODE_ENV production
WORKDIR /app
COPY --from=prune /go/bin/node-prune /usr/local/bin/
ADD . .
RUN npm install --quiet
RUN node-prune

FROM node:14.11-alpine
ENV NODE_ENV production
WORKDIR /app
COPY --from=build /app .
COPY --from=stress /usr/local/bin/stress /usr/bin
CMD ["node", "server.js"]
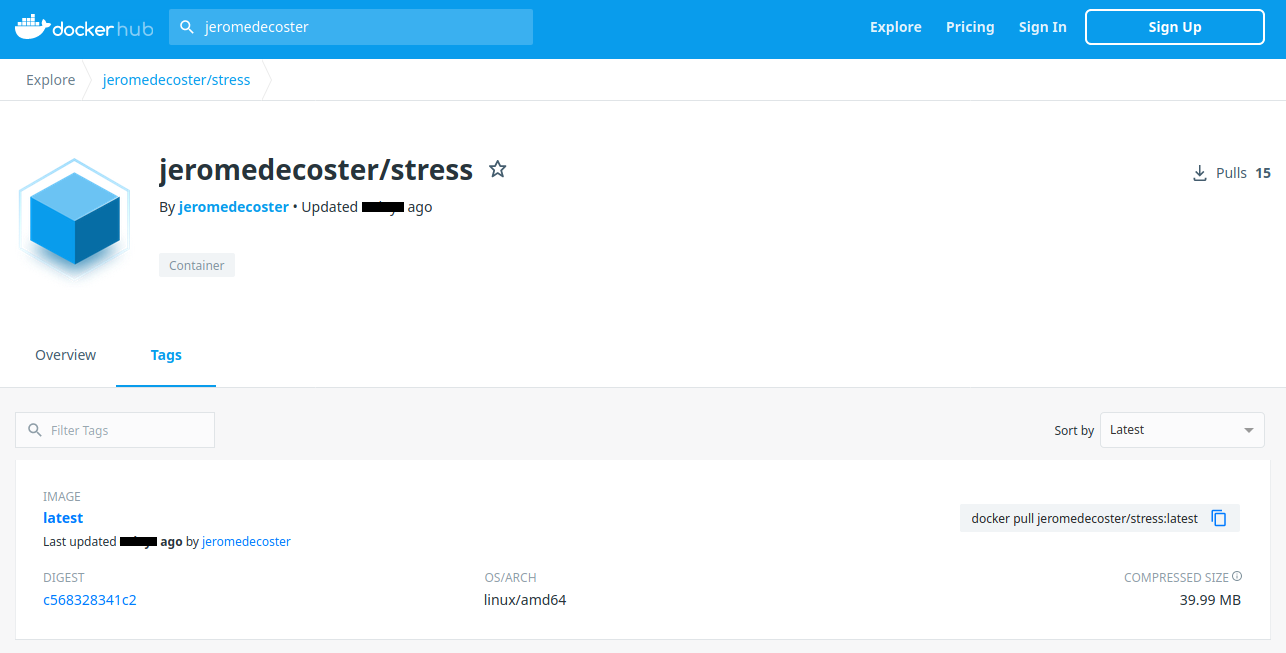
And published on docker hub :
Creating the cluster
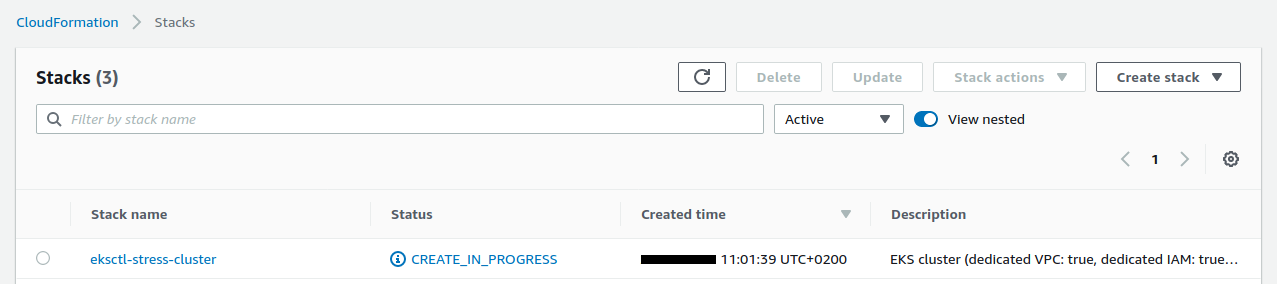
We launch the creation of the EKS cluster. You have to be patient because it takes about 15 minutes !
# create the EKS cluster
$ make cluster-create
This command executes this script :
# create the EKS cluster
$ eksctl create cluster \
    --name stress \
    --region eu-west-3 \
    --managed \
    --node-type t2.large \
    --nodes 1 \
    --profile default
The cluster is creation is in progress :
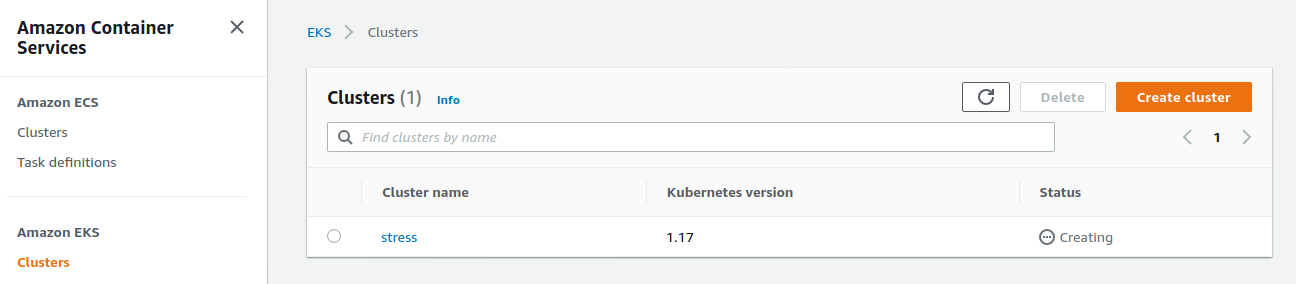
Once the cluster is ready, we can query it :
$ kubectl get ns
NAME              STATUS   AGE
default           Active   5m
kube-node-lease   Active   5m
kube-public       Active   5m
kube-system       Active   5m
The cluster was created with EC2 instances of type t2.large.
The size of these instances allows us to be able to create up to 35 pods :
We get this information with this command :
$ kubectl get nodes -o yaml
We get the information here :
apiVersion: v1
items:
- apiVersion: v1
  kind: Node
  metadata:
    annotations:
    # ...
    capacity:
      attachable-volumes-aws-ebs: "39"
      cpu: "2"
      ephemeral-storage: 83873772Ki
      hugepages-2Mi: "0"
      memory: 8166336Ki
      pods: "35" #  <-- max pods
If we had used t2.small, we would have had too few pods available for our project :
$ kubectl get nodes -o yaml | grep pods
pods: "11"
Here is the number of pods currently in use :
# current pods
$ kubectl get pods --all-namespaces | grep Running | wc -l
4
Installation of Prometheus and Grafana
Manually and correctly installing Prometheus and Grafana in a growing and shrinking Kubernetes cluster is a complex task.
The excellent kube-prometheus project takes care of everything.
Our EKS cluster runs Kubernetes 1.17.
As indicated by the compatibility matrix table, we will therefore use version 0.4 of the project :
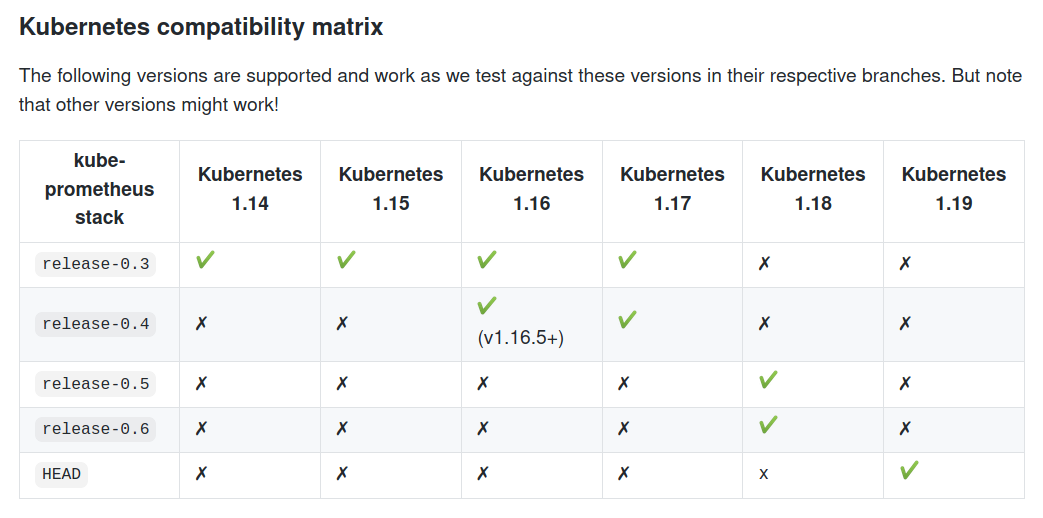
Version 0.4 was already downloaded when we ran the make setup command.
In a terminal window, we run the following command to see, every 2 seconds, the evolution of the content of the monitoring namespace :
$ watch kubectl -n monitoring get all

No resources found in monitoring namespace.
We install Prometheus and Grafana with this command :
# deploy prometheus + grafana service to EKS
$ make cluster-deploy-prometheus-grafana
This command executes this script :
$ kubectl create -f kube-prometheus-0.4.0/manifests/setup
$ kubectl create -f kube-prometheus-0.4.0/manifests
Our terminal quickly displays many changes :
$ watch kubectl -n monitoring get all

NAME                                      READY   STATUS    RESTARTS   AGE
pod/alertmanager-main-0                   2/2     Running   0          40s
pod/alertmanager-main-1                   2/2     Running   0          40s
pod/alertmanager-main-2                   2/2     Running   0          40s
pod/grafana-58dc7468d7-rslg8              1/1     Running   0          25s
pod/kube-state-metrics-765c7c7f95-mc2sx   3/3     Running   0          25s
pod/node-exporter-8s5xx                   2/2     Running   0          25s
pod/prometheus-adapter-5cd5798d96-8d6fc   1/1     Running   0          25s
pod/prometheus-k8s-0                      3/3     Running   1          25s
pod/prometheus-k8s-1                      3/3     Running   1          25s
pod/prometheus-operator-99dccdc56-zj8bp   1/1     Running   0          50s

NAME                            TYPE        CLUSTER-IP       EXTERNAL-IP   PORT(S)                      AGE
service/alertmanager-main       ClusterIP   10.100.9.140     <none>        9093/TCP                     40s
service/alertmanager-operated   ClusterIP   None             <none>        9093/TCP,9094/TCP,9094/UDP   40s
service/grafana                 ClusterIP   10.100.204.74    <none>        3000/TCP                     25s
service/kube-state-metrics      ClusterIP   None             <none>        8443/TCP,9443/TCP            25s
service/node-exporter           ClusterIP   None             <none>        9100/TCP                     25s
service/prometheus-adapter      ClusterIP   10.100.214.16    <none>        443/TCP                      25s
service/prometheus-k8s          ClusterIP   10.100.203.191   <none>        9090/TCP                     25s
service/prometheus-operated     ClusterIP   None             <none>        9090/TCP                     25s
service/prometheus-operator     ClusterIP   None             <none>        8080/TCP                     50s

NAME                           DESIRED   CURRENT   READY   UP-TO-DATE   AVAILABLE   NODE SELECTOR            AGE
daemonset.apps/node-exporter   1         1         1       1            1           kubernetes.io/os=linux   25s

NAME                                  READY   UP-TO-DATE   AVAILABLE   AGE
deployment.apps/grafana               1/1     1            1           25s
deployment.apps/kube-state-metrics    1/1     1            1           25s
deployment.apps/prometheus-adapter    1/1     1            1           25s
deployment.apps/prometheus-operator   1/1     1            1           50s

NAME                                            DESIRED   CURRENT   READY   AGE
replicaset.apps/grafana-58dc7468d7              1         1         1       25s
replicaset.apps/kube-state-metrics-765c7c7f95   1         1         1       25s
replicaset.apps/prometheus-adapter-5cd5798d96   1         1         1       25s
replicaset.apps/prometheus-operator-99dccdc56   1         1         1       50s

NAME                                 READY   AGE
statefulset.apps/alertmanager-main   3/3     40s
statefulset.apps/prometheus-k8s      2/2     25s
Installation of our website
We are now going to set up our stress testing website :
# deploy stress service to EKS
$ make cluster-deploy-stress
This command executes this script :
$ kubectl create -f k8s/namespace.yaml
$ kubectl create -f k8s/deployment.yaml
$ kubectl create -f k8s/service.yaml
The deployment.yaml file is essential because it defines the autoscaling and its constraints :
---
apiVersion: apps/v1
kind: Deployment
metadata:
  name: website
  namespace: website
  labels:
    app: website
spec:
  replicas: 1
  selector:
    matchLabels:
      app: website
  template:
    metadata:
      labels:
        app: website
    spec:
      containers:
      - name: website
        image: jeromedecoster/stress:1.0.0
        ports:
        - containerPort: 3000
          name: website
        resources:
          limits:
            cpu: 0.1
          requests:
            cpu: 0.1
---
apiVersion: autoscaling/v1
kind: HorizontalPodAutoscaler
metadata:
  name: website-hpa
  namespace: website
spec:
  scaleTargetRef:
    apiVersion: apps/v1
    kind: Deployment
    name: website
  minReplicas: 1
  maxReplicas: 5
  targetCPUUtilizationPercentage: 10
Pod resource usage limits are defined by :
resources:
  limits:
    cpu: 0.1
  requests:
    cpu: 0.1
The number of replicas variations is defined by :
minReplicas: 1
maxReplicas: 5
targetCPUUtilizationPercentage: 10
In a terminal window, we run the following command to see, every 2 seconds, the evolution of the content of the website namespace :
$ watch kubectl -n website get all

NAME                           READY   STATUS    RESTARTS   AGE
pod/website-647bcb8859-gjbr2   1/1     Running   0          80s

NAME              TYPE           CLUSTER-IP       EXTERNAL-IP                          PORT(S)        AGE
service/website   LoadBalancer   10.100.211.221   abcdef.eu-west-3.elb.amazonaws.com   80:30507/TCP   80s

NAME                      READY   UP-TO-DATE   AVAILABLE   AGE
deployment.apps/website   1/1     1            1           80s

NAME                                 DESIRED   CURRENT   READY   AGE
replicaset.apps/website-647bcb8859   1         1         1       80s

NAME                                              REFERENCE            TARGETS         MINPODS   MAXPODS   REPLICAS   AGE
horizontalpodautoscaler.autoscaling/website-hpa   Deployment/website   <unknown>/10%   1         5         1          80s
We currently have 15 pods in operation :
$ kubectl get pods --all-namespaces | grep Running | wc -l
15
Connection to Prometheus
We now use the port-forward command to connect to Prometehus in localhost:9090 :
$ kubectl -n monitoring port-forward service/prometheus-k8s 9090:9090
Forwarding from 127.0.0.1:9090 -> 9090
Forwarding from [::1]:9090 -> 9090
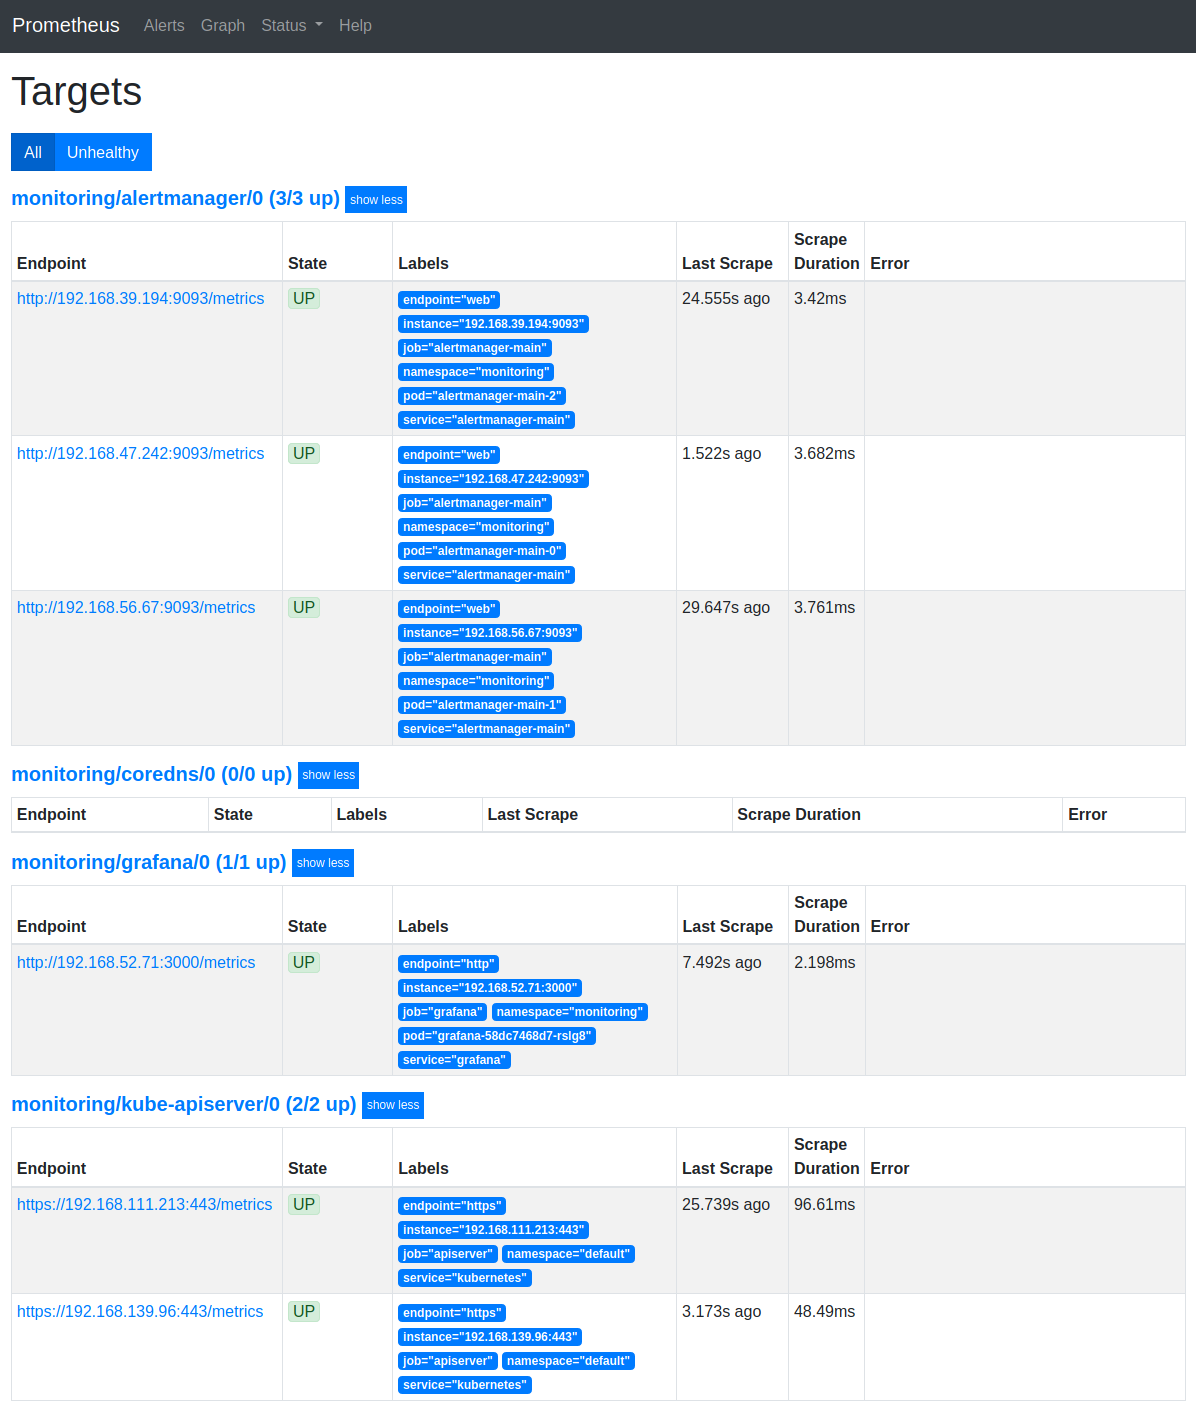
I can see the impressive number of targets already set by kube-prometheus :
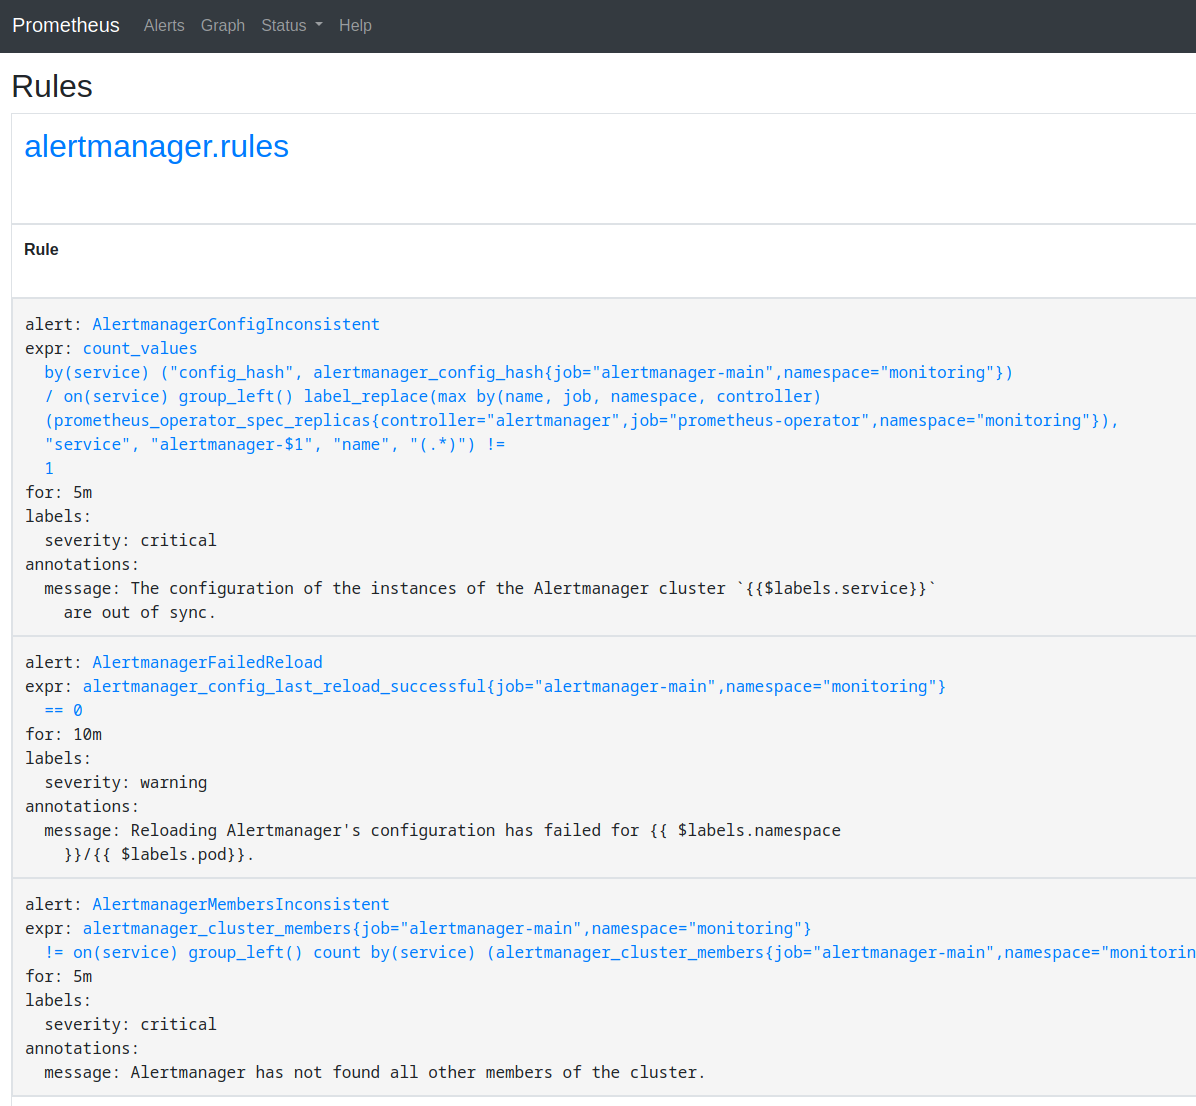
Here is also a part of the very many rules :
Connection to Grafana and add a dashboard
In another terminal window, we use the port-forward command to connect to Grafana in localhost:3000 :
$ kubectl -n monitoring port-forward service/grafana 3000:3000
Forwarding from 127.0.0.1:3000 -> 3000
Forwarding from [::1]:3000 -> 3000
We log in with :
- User :
admin - Password :
admin

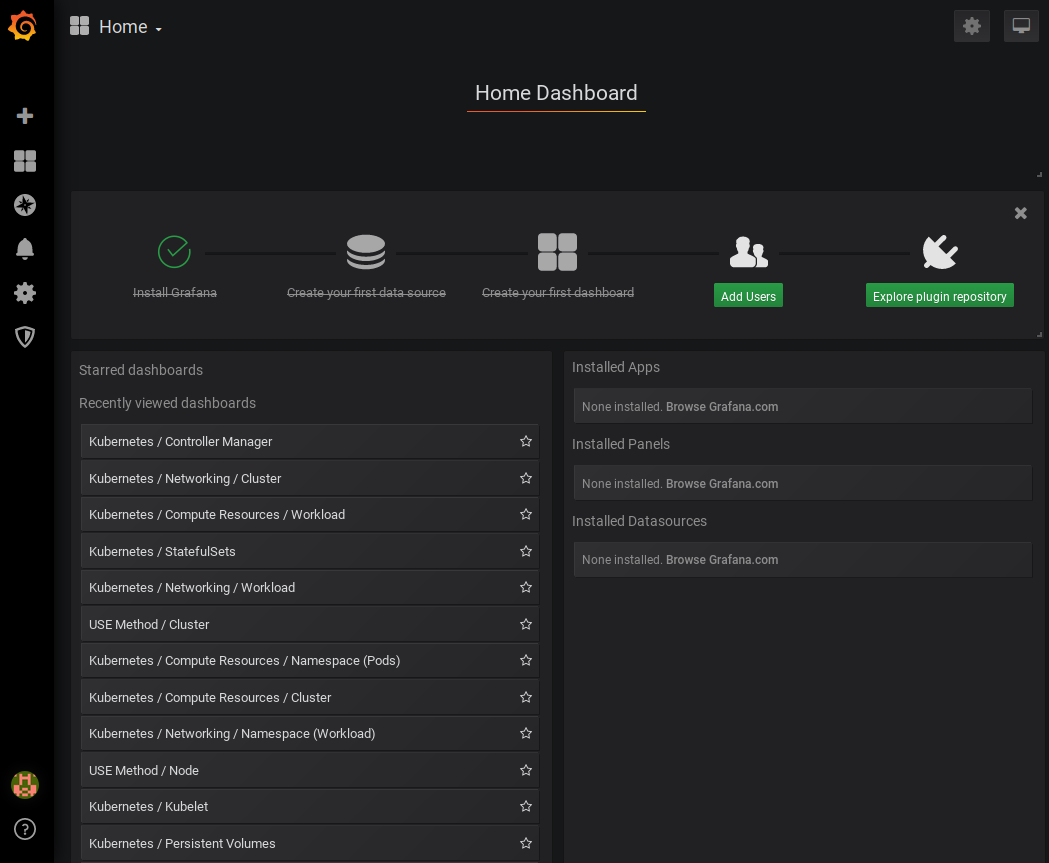
Once logged in you can see some of the impressive list of dashboards defined by kube-prometheus :
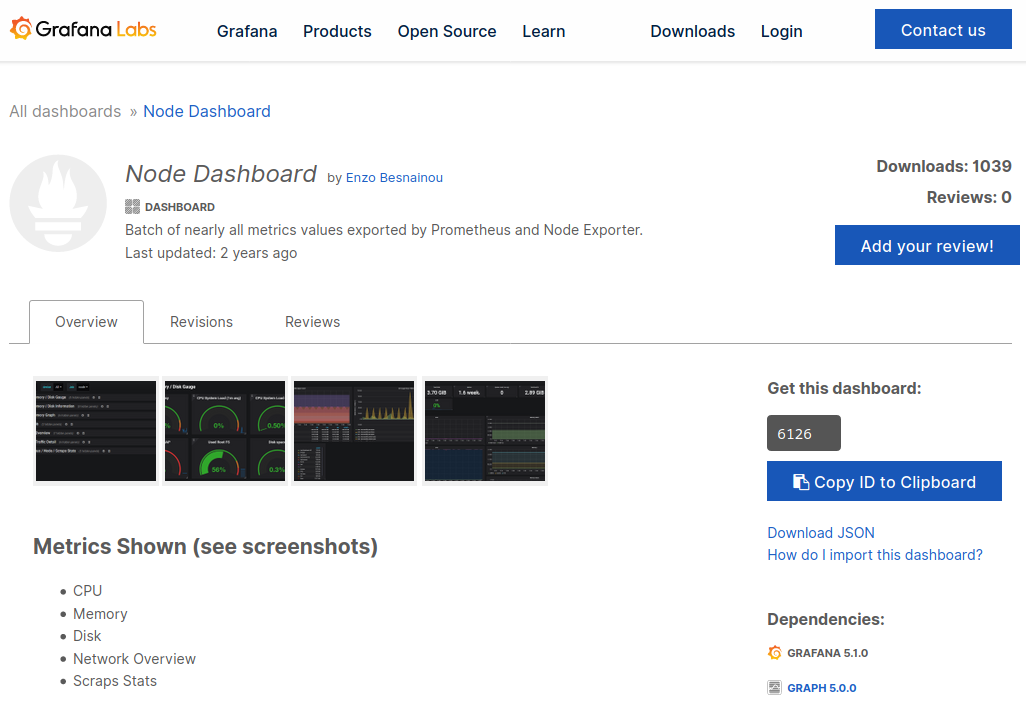
These dashboards are intended for kubernetes only. We will import a dashboard dedicated to the metrics returned by Node Exporter :
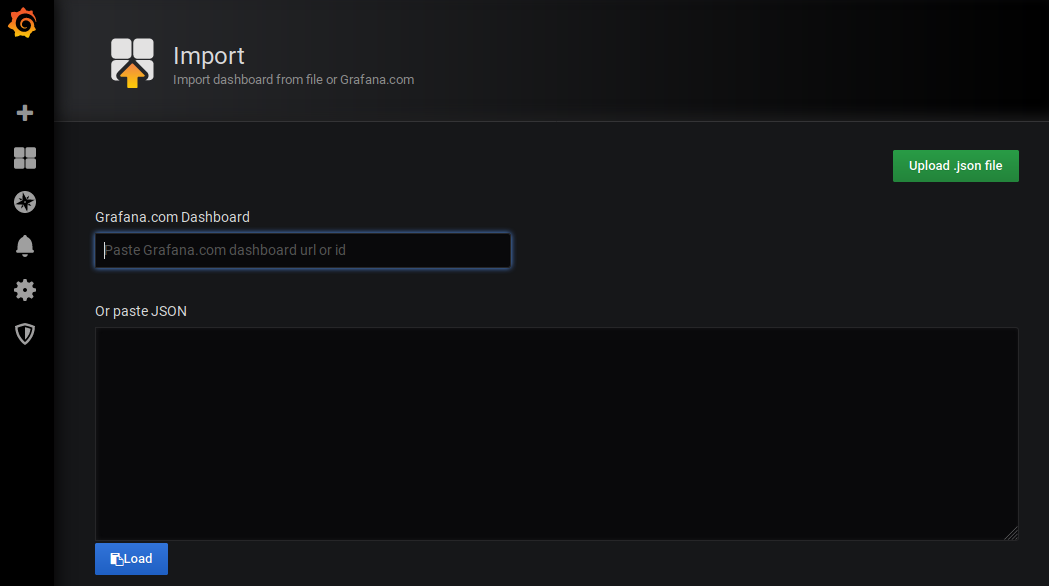
We will import the dashboard #6126 :
We choose :
- ID :
6126 - DataSource :
promotheus
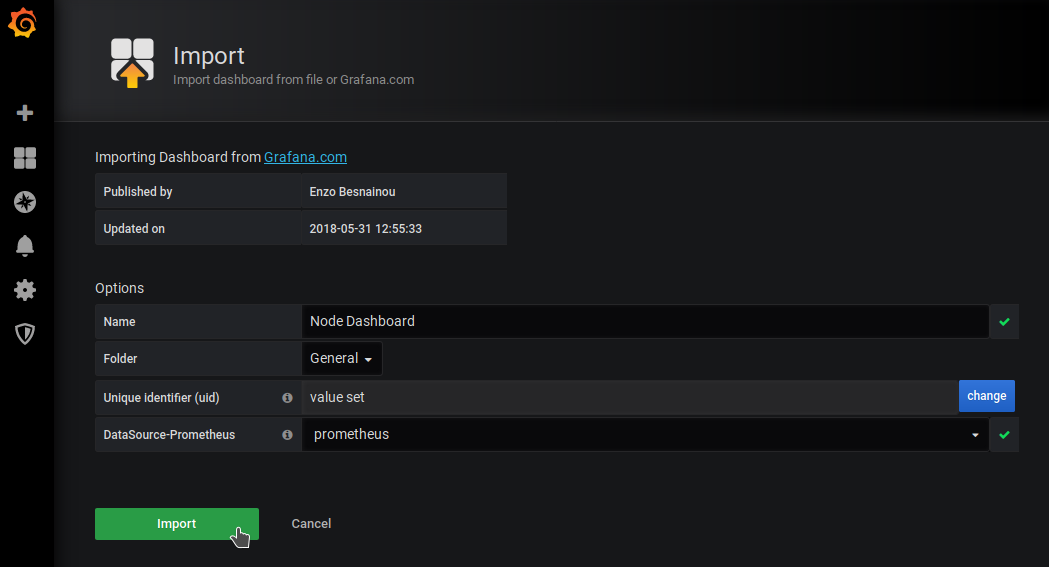
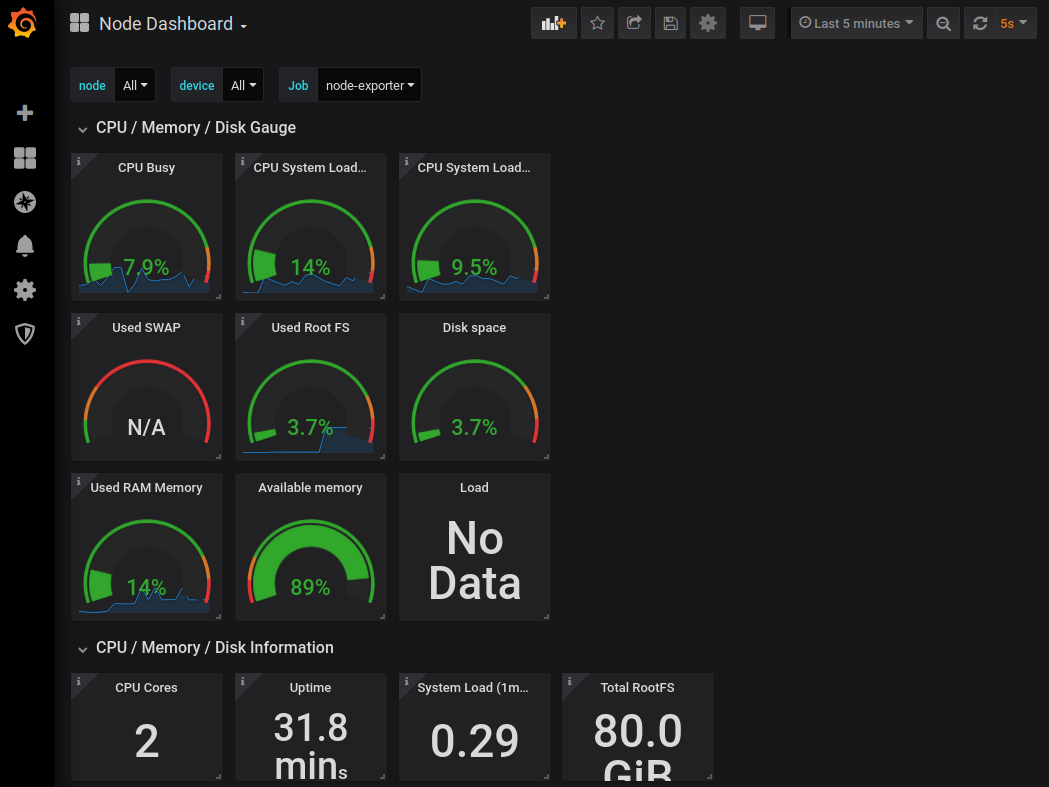
The dashboard is imported and works correctly :
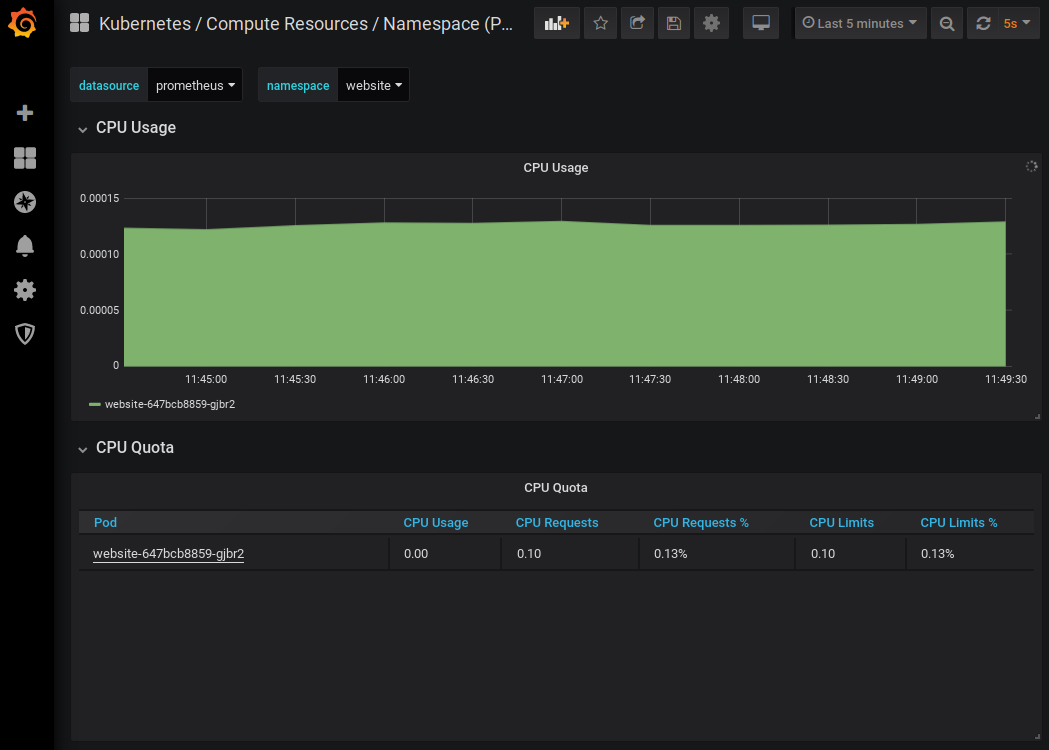
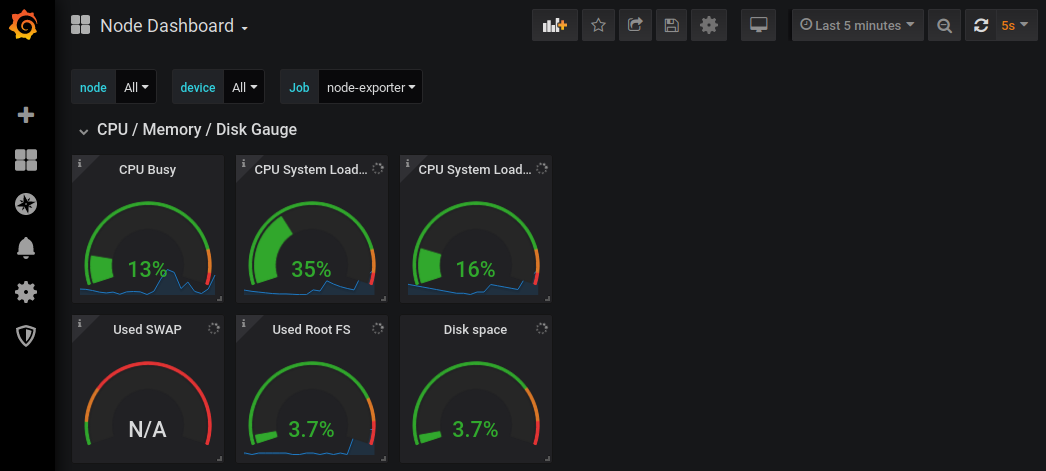
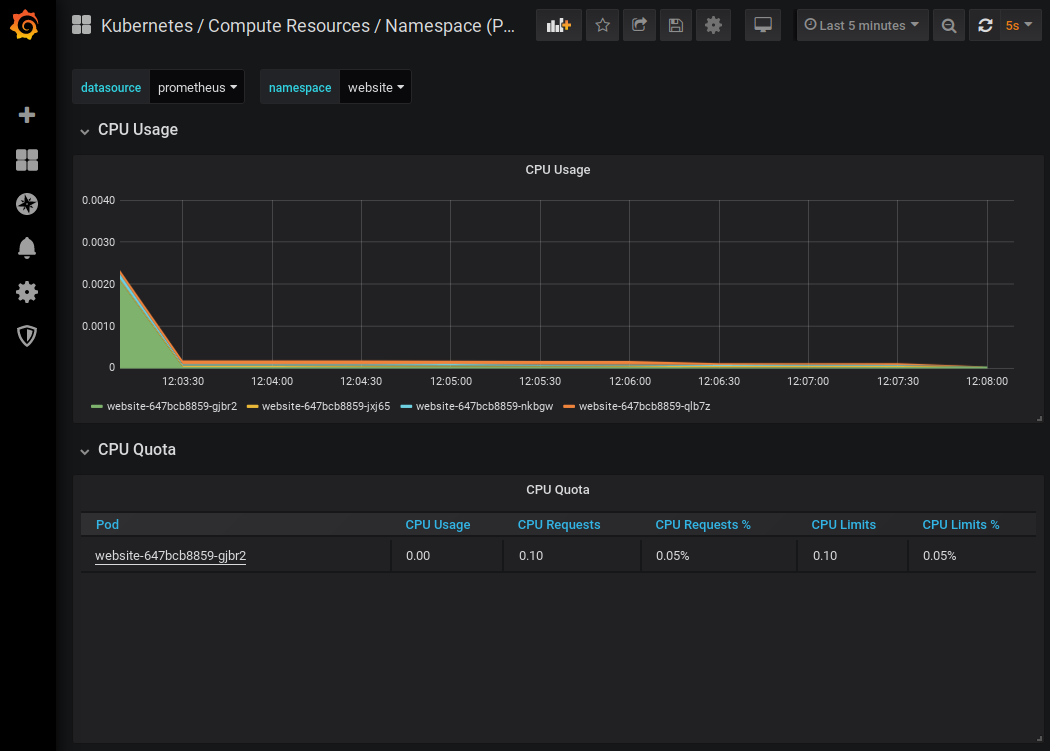
In another tab of my browser I display the resources used in the webite namespace :
Stress test and autoscaling
We get the public address of the Load Balancer with the command :
$ make cluster-elb
abcdef.eu-west-3.elb.amazonaws.com
This command executes this script :
$ kubectl get svc \
    --namespace website \
    --output jsonpath="{.items[?(@.metadata.name=='website')].status.loadBalancer.ingress[].hostname}"
By pasting this URL in my browser, I see my website :
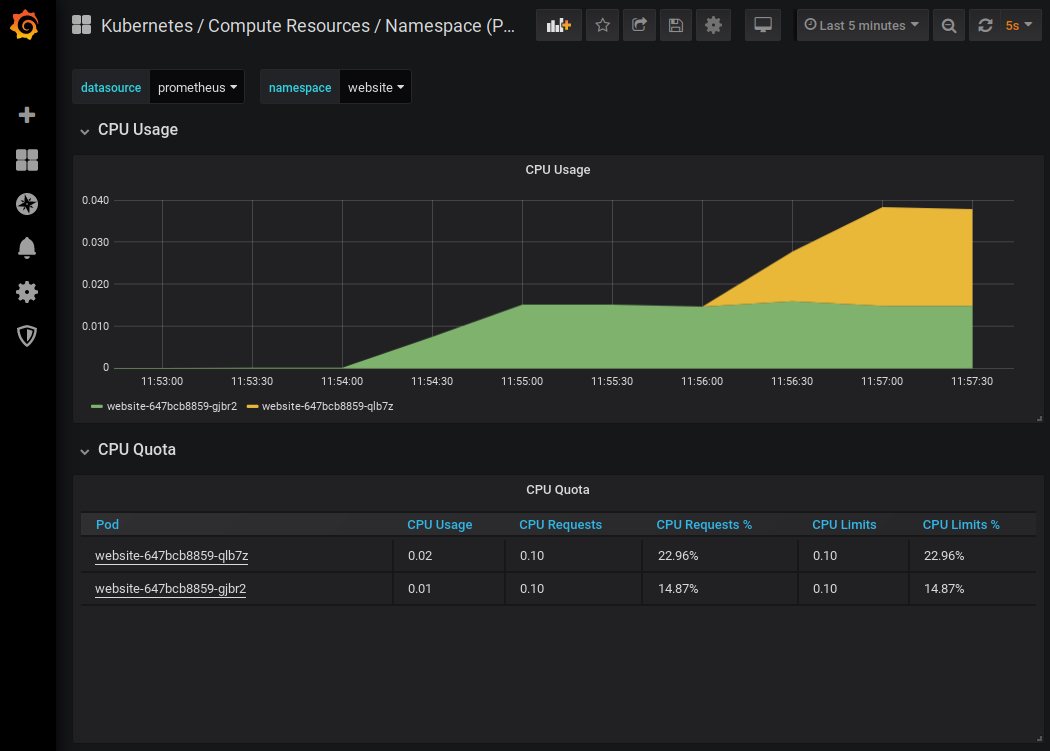
We start a powerful and long CPU stress :
The data returned by Node Exporter grows rapidly :
A pod has been added, the autoscaling is working correctly :
We see the same evolution in our terminal window :
$ watch kubectl -n website get all

NAME                           READY   STATUS    RESTARTS   AGE
pod/website-647bcb8859-gjbr2   1/1     Running   0          30m
pod/website-647bcb8859-qlb7z   1/1     Running   0          100s

NAME              TYPE           CLUSTER-IP       EXTERNAL-IP                          PORT(S)        AGE
service/website   LoadBalancer   10.100.211.221   abcdef.eu-west-3.elb.amazonaws.com   80:30507/TCP   30m

NAME                      READY   UP-TO-DATE   AVAILABLE   AGE
deployment.apps/website   2/2     2            2           30m

NAME                                 DESIRED   CURRENT   READY   AGE
replicaset.apps/website-647bcb8859   2         2         2       30m

NAME                                              REFERENCE            TARGETS   MINPODS   MAXPODS   REPLICAS   AGE
horizontalpodautoscaler.autoscaling/website-hpa   Deployment/website   14%/10%   1         5         2          30m
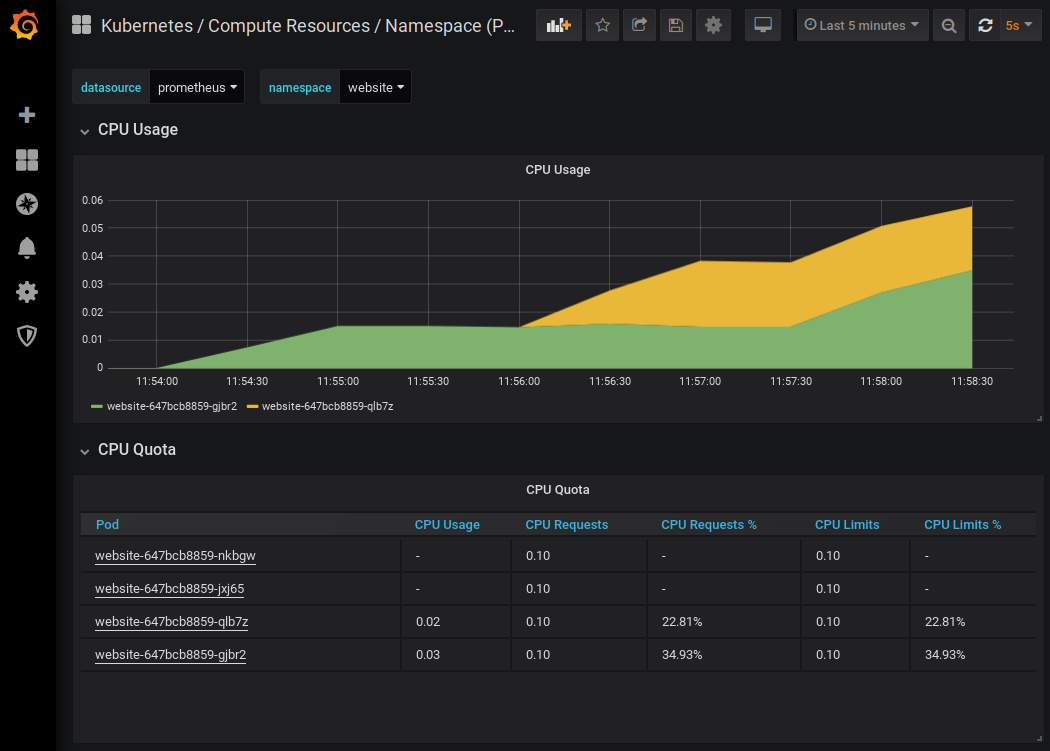
The stress continues. The CPU increases, so does the number of pods :
We see the same evolution in our terminal window :
$ watch kubectl -n website get all

NAME                           READY   STATUS    RESTARTS   AGE
pod/website-647bcb8859-gjbr2   1/1     Running   0          35m
pod/website-647bcb8859-jxj65   1/1     Running   0          45s
pod/website-647bcb8859-nkbgw   1/1     Running   0          75s
pod/website-647bcb8859-qlb7z   1/1     Running   0          5m

NAME              TYPE           CLUSTER-IP       EXTERNAL-IP                          PORT(S)        AGE
service/website   LoadBalancer   10.100.211.221   abcdef.eu-west-3.elb.amazonaws.com   80:30507/TCP   35m

NAME                      READY   UP-TO-DATE   AVAILABLE   AGE
deployment.apps/website   4/4     4            4           35m

NAME                                 DESIRED   CURRENT   READY   AGE
replicaset.apps/website-647bcb8859   4         4         4       35m

NAME                                              REFERENCE            TARGETS   MINPODS   MAXPODS   REPLICAS   AGE
horizontalpodautoscaler.autoscaling/website-hpa   Deployment/website   28%/10%   1         5         4          35m
After several minutes of waiting, the metrics fell back.
La mise à l’échelle automatique de kubernetes a fini par supprimer tous les pods qui avaient été créés :
The demonstration is over. We can delete our cluster with this command :
$ make cluster-delete